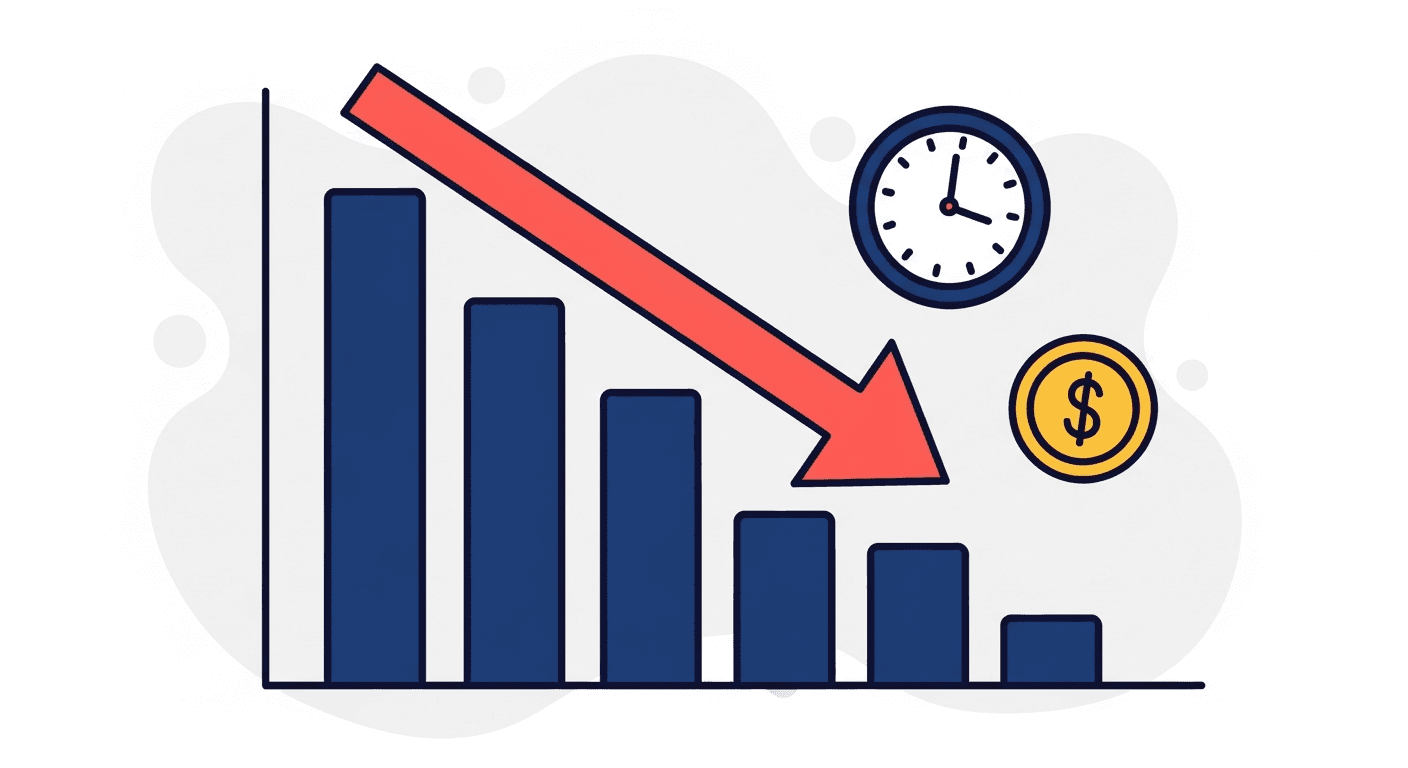
The standard cash collections formula (Beginning AR + Credit Sales - Ending AR) tells you what happened, not what will happen. To actually forecast when customers will pay, segment them by payment behavior, track individual patterns, and build customer-specific predictions. This approach reduces forecast variance from 30-50% down to 5-10%.
Every finance team knows the textbook cash collections formula:
Cash Collections = Beginning AR + Credit Sales - Ending AR
It is clean, simple, and nearly useless for predicting when your customers will actually pay.
The formula tells you what happened last quarter. It does not tell you what will happen next month. And if you are using it to forecast cash flow, you are building plans on a foundation that produces 30-50% variance from reality.
This guide covers why the textbook formula fails, how to build a customer-specific approach that actually predicts collections, and what to track so your forecasts get more accurate over time.
Why the textbook formula fails in practice
The standard approach to forecasting collections goes like this: take your outstanding AR, apply generic percentages (60% collected in 30 days, 30% in 60 days, 10% in 90 days), and project your cash inflows.
The problem is that generic percentages do not match real customer behavior. Your customers are not a homogeneous group.
Consider two businesses:
- A SaaS company where 80-90% of invoices are paid within 30 days via automated billing
- A construction company where 42% of receivables are still unpaid after 90 days
Applying the same "60/30/10" assumption to both produces wildly inaccurate forecasts. And even within a single company, different customer segments pay at completely different rates.
This is why textbook forecasting produces 30-50% variance. It is not a rounding error. It is a fundamental flaw in the model.
The customer-specific approach
The fix is to stop forecasting based on generic assumptions and start forecasting based on how your customers actually behave.
Step 1: Segment by payment behavior
Group your customers into three categories based on their actual payment history:
Prompt payers. These customers pay within your stated terms or close to it. They are reliable and predictable. You can forecast their payments with high confidence.
Slow but reliable. These customers consistently pay late (15-30 days past terms) but they always pay eventually. Their behavior is predictable once you adjust your expectations. Do not treat them the same as prompt payers in your forecast.
High-risk. These customers are unpredictable. They may pay on time one month and 60 days late the next. They have higher dispute rates and occasionally do not pay at all. Your forecast for this segment needs a wider margin.
Step 2: Track individual payment patterns
For each segment, track these metrics:
- Average days to pay (not days past due, but actual days from invoice to payment)
- Payment reliability (what percentage of invoices are paid in full without intervention?)
- Dispute frequency (how often do they raise issues that delay payment?)
- Seasonal patterns (do they pay slower at quarter-end or during certain months?)
With 2-3 months of data, you will have a much more accurate picture than any generic percentage can provide.
Step 3: Build segment-specific forecasts
Instead of applying one formula to all AR, apply different collection rates to each segment:
- Prompt payers: Forecast 95% collection within your stated terms
- Slow but reliable: Forecast 90% collection at their historical average (e.g., terms + 20 days)
- High-risk: Forecast 70% collection at their historical average, with a 30% reserve for delays or losses
This approach reduces forecast variance from 30-50% down to 5-10%. It will not be perfect, but it will be accurate enough to make confident business decisions.
How your collection strategy changes the formula
Here is the part most forecasting guides miss: your collection process directly changes the inputs to your formula. Better collections do not just reduce DSO (use our free DSO calculator to see how much cash a lower DSO frees up). They shift customers between segments.
A "slow but reliable" customer who gets consistent, multi-channel reminders may start paying within terms. A "high-risk" customer who gets early escalation may move to "slow but reliable" instead of defaulting.
This creates a virtuous cycle:
- Better collection processes accelerate payment
- Faster payment improves your forecast accuracy
- Accurate forecasts enable better business decisions
- Better decisions create room to invest in more improvements
The opposite is also true. Manual, inconsistent follow-up creates a failure cycle where invoices age, forecasts miss, and the team spends more time firefighting instead of improving.
From spreadsheets to automated forecasting
Manual forecasting has a ceiling. At some point, the number of customers, invoices, and variables exceeds what a spreadsheet can reliably track. Finance teams report spending 15+ hours per week maintaining manual AR forecasts, and the accuracy still degrades as the business grows.
The shift from manual to automated happens in three stages:
Stage 1: Automated reminders. Tools like Yonovo handle the collection workflow automatically. This alone changes your formula inputs by accelerating payment across all segments.
Stage 2: Real-time visibility. Instead of reconciling AR data weekly or monthly, you see the current state of every invoice, every day. Aging dashboards show which invoices are on track and which are at risk.
Stage 3: Pattern recognition. With enough data flowing through an automated system, you can identify payment patterns that manual tracking would miss. Which customers always pay on the 15th? Which ones slow down in Q4? Which ones pay faster when they receive an SMS instead of an email?
What good forecasting looks like
You will know your forecasting is working when:
- Forecast variance is below 10%. If your projected collections for next month are within 10% of actual collections, you have a reliable model.
- No surprises at month-end. Your cash position on the last day of the month should match what you predicted at the beginning.
- Segment behavior is tracked. You can explain why your forecast was off (a specific customer paid late, a new customer in the high-risk segment) rather than shrugging.
- The forecast improves over time. Each month should be slightly more accurate than the last as you accumulate more data and refine your segments.
If your current forecasting process involves copying AR data into a spreadsheet and applying the same percentages you used last year, there is a significant accuracy improvement available by switching to the customer-specific approach.
For the best tools to automate this process, see our comparison of AR automation platforms.
Frequently Asked Questions
What is the cash collections formula?
The basic cash collections formula is: Cash Collections = Beginning Accounts Receivable + Credit Sales - Ending Accounts Receivable. It calculates how much cash was collected during a specific period by comparing AR balances at the start and end. While useful for historical analysis, it does not predict future collections because it assumes customers behave consistently, which they do not.
Why is the cash collections formula inaccurate for forecasting?
The textbook formula uses generic assumptions like 60% collected in 30 days and 30% in 60 days. In reality, customer payment behavior varies enormously. A SaaS company might collect 80-90% within 30 days while a construction company collects only 58% in the same period. Generic assumptions produce 30-50% forecast variance, making the predictions unreliable for business planning.
How do you improve cash collection forecasting accuracy?
Segment customers into groups based on actual payment behavior: prompt payers (pay within terms), slow-but-reliable (consistently late but always pay), and high-risk (unpredictable, frequent disputes). Track each segment's average days to pay, then forecast based on real patterns instead of textbook percentages. This approach reduces variance from 30-50% to 5-10%.
What metrics should I track to improve collections?
Track DSO (Days Sales Outstanding), Best Possible DSO, Collection Effectiveness Index (CEI), percentage of AR over 90 days, and average days delinquent per customer segment. These metrics together tell you whether your collections process is improving and where to focus your efforts. DSO alone is not enough because it can mask problems in specific segments.
How long does it take to see improvement in cash collections?
Most businesses see measurable improvement within 30-60 days of implementing structured follow-up processes and automation. Customer-specific forecasting accuracy improves over 2-3 months as you accumulate enough payment history data. The fastest wins come from identifying your high-risk segment and applying focused attention to those accounts first.